An Inexpensive Network Emulator for Testing Applications
Stu Mitchell
August 25, 2006
Executive Summary
This paper presents a simple and inexpensive methodology for predicting performance of a client/server application over a wide area network. A network emulator, placed between the client and server, is used to vary key network properties, such as latency, bandwidth and packet loss. This method is not meant to replace extensive network modeling tools such as OPNET or Load Runner, however, it can provide developers with a simple way to explore the behavior of applications over a wide area network before deployment. For example, developers will be able to determine performance over a dial-up line or low speed frame relay circuit.
The emulator uses the Linux operating system on a PC with built-in emulation and queuing utilities. The PC is configured to operate in 'bridge' mode, which eliminates IP readdressing requirements. Performance of the emulator was validated using tests detailed in Appendix A.
Bandwidth
Bandwidth provides a measure of the link capacity and is usually specified as bits per second (bps) or bytes per second (Bps.) Increased bandwidth allows more data to flow over a link in the same amount of time.
When circuits are added in series, the bottle neck is the link with the slowest bandwidth. For example, if the network path consists of a 128Kbps circuit, linked to an OC-3 (155MBps) backbone and finally a DS-3 (45Mbps), the network bottle neck is the 128Kbps circuit. Meaning, it's not possible to push data through the total circuit faster than 128Kbps.
The bandwidth of the network emulator represents the slowest possible link in the circuit path. Since most circuit paths within the ESN will be symmetrical, identical bandwidth parameters will be applied to incoming and outgoing packets. Different bandwidths could be applied to simulate links such as asymmetrical digital subscriber lines (ADSL.)
Network Latency
Latency is the measure of the time for a packet to traverse the circuit path and is usually expressed in terms of milliseconds. Each circuit, router, switch and other equipment within a circuit path increases the latency. Wide area network circuits account for the largest part of the network delay. The equipment usually adds less than a millisecond per device.
Table 1 shows typical latency values for each component. The values for applications (A and B) vary widely and are application dependent. This test scenario does not include these values, although, it is recognized network latency could have an impact on the overall performance. For example, if the latency exceeds an application retry timeout threshold, the application may request unnecessary retries, which could result in increased traffic and poorer performance overall.
| WAN | LAN | Equipment | Application | Total Latency | |
| Zone 1– Remote | 10ms | 2ms | 1ms | A | 13ms+A |
| Zone 2– Network | 60ms | 60ms | |||
| Zone 3– Client | 10ms | 2ms | 1ms | B | 13ms + B |
| Totals | 80ms | 4ms | 2ms | A + B | 86 ms + B |
From the table, it's clear the wide area network links contribute the largest delay in the total latency. The network emulator applies the total latency (expect A and B) to the circuit path.
The 'ping' utility measures round trip delay, which is the total time for a request and answer to travel a circuit. (i.e. out and back time) Path delays may not be symmetrical. Tools such as the one way ping' utility from the Internet end-to-end initiative can be used to measure the link in one direction, but they require additional equipment and software.
The Department's Enterprise Services Network (ESN) uses Cisco's proxy ping utility to measure round trip delay. Infovista retrieves, stores and trends this information, which creates the performance measuring baseline. The network emulator can apply delay to both incoming and outgoing packets to simulate asymmetrical delays. To simplify testing, identical delays will be used.
Bandwidth Delay Product
Application performance over a wide area network is limited by both latency (delay) and throughput (bandwidth.) For example, the link may have low latency, but not enough capacity to support the application. Similarly, the link may have a lot of bandwidth (e.g. satellite circuits,) but too much latency. (This second problem is also known as the 'long, fat pipe' problem, which affects TCP performance.)
| 50ms | 80ms | 100ms | 150ms | 200ms | 400ms | 800ms | |
| T1-(1.54Mbs) | |||||||
| 768Kbps | |||||||
| 128Kbps | |||||||
| 64Kbps |
Each application may require different bandwidth delay products (BDP.) For example, an interactive, console based application requires very little bandwidth and the limiting factor is the latency. As the interaction between the client and server increase, both factors may become important.
Bandwidth Delay Product is measured in terms of (b/s x s) bits. In order to fully utilize a circuit, the TCP buffer should be at least the BDP.
Packet Loss
Not all packets reach their destinations. TCP can detect dropped packets and ask for a retry. However, this process slows performance. Packet loss ratio should be less than .1%. The network emulator can implement packet loss algorithms, but there are no plans to map application behavior over various packet loss ratios.
Testing Architecture
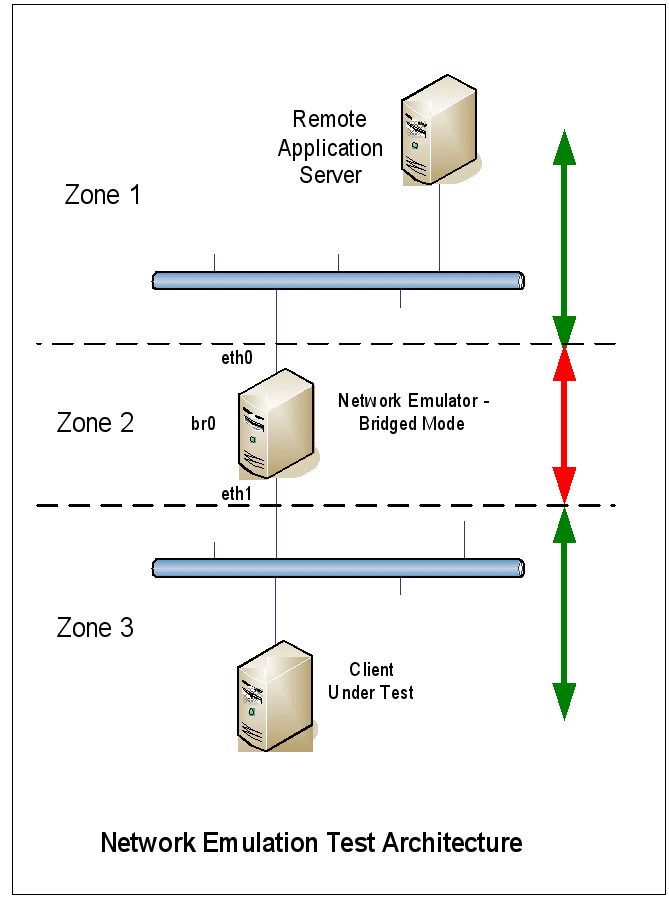
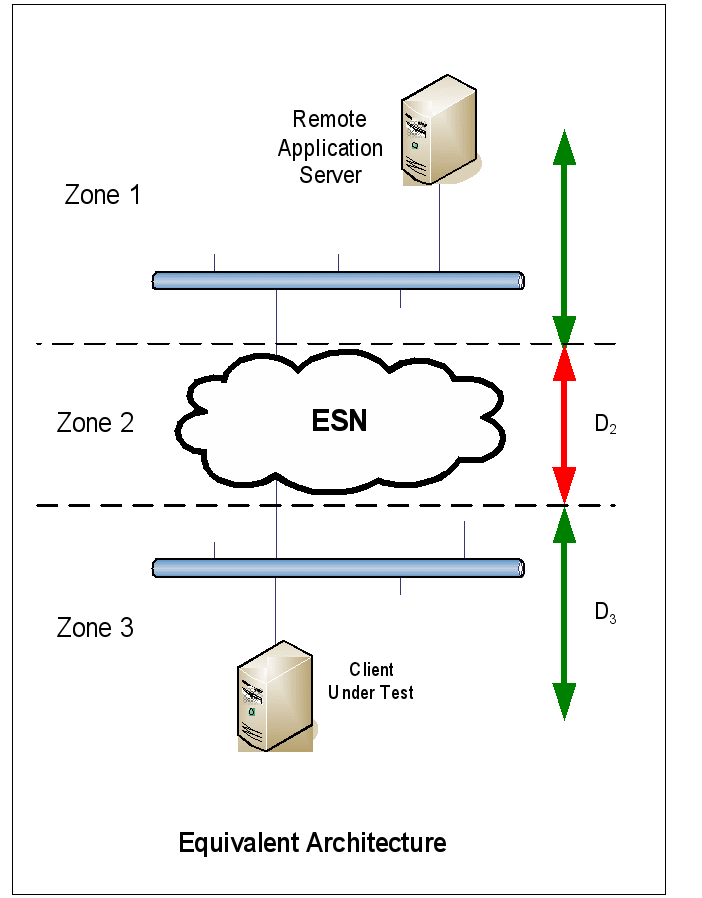
Figure 1 depict the test architecture and is equivalent to Figure 2. There are three zones which are referenced in the following discussions.


The following describes the components for each zone.
Zone 1 – Remote Server End
- WAN Circuit – connects remote site to the network backbone
- LAN (switches,hubs) – local area network
- Equipment – routers, firewalls, security devices
- Application, server (computer, application) – varies greatly
Zone 2 - Network
- WAN – network ‘cloud’ which includes
- Backbone transport
- Associated WAN equipment (routers, switches, etc.)
- Based on service level agreement
Zone 3 – Client End
- WAN Circuit – connects remote site to the network backbone
- LAN (switches, hubs) – local area network
- Equipment –routers, firewalls, security devices
- Application, client (computer, application) – varies greatly
Testing Methodology
Testing is straightforward and detailed instructions are not provided. Testing the client/server performance is very subjective and should be thought of in terms of:
- acceptable – test does not significantly affect the application
- marginal – some degradation detected, but probably OK to use
- unacceptable – absolutely can’t be deployed under these conditions
If more detailed test results are required (e.g. transaction times,) another tool should be used to model the application.
- Insert the emulator as indicated in Figure 1
- Configure the PC for bridge mode
- Verify client/server connectivity
- Enable QoS (see appendix A for details)
- Run client/server tests (repeat)
Vary latency and bandwidth to obtain values for each cell in the following table:
| 50ms | 80ms | 100ms | 150ms | 200ms | 400ms | 800ms | |
| T1-(1.54Mbs) | |||||||
| 768Kbps | |||||||
| 128Kbps | |||||||
| 64Kbps |
Vary packet loss using the values .01%, .1%, 1% and 3%
Reference Links
- http://tools.ietf.org/html/draft-ietf-nsis-y1541-qosm-02 - y.1541 class of service IETF draft
- http://linux-net.osdl.org/index.php/Netem - the netem wiki
- http://lartc.org/howto/lartc.qdisc.html- Linux advanced routing
- http://luxik.cdi.cz/~devik/qos/htb/ - HTB home page
- http://mgen.pf.itd.nrl.navy.mil/ - Naval Research Lab, Network and Communications System Branch